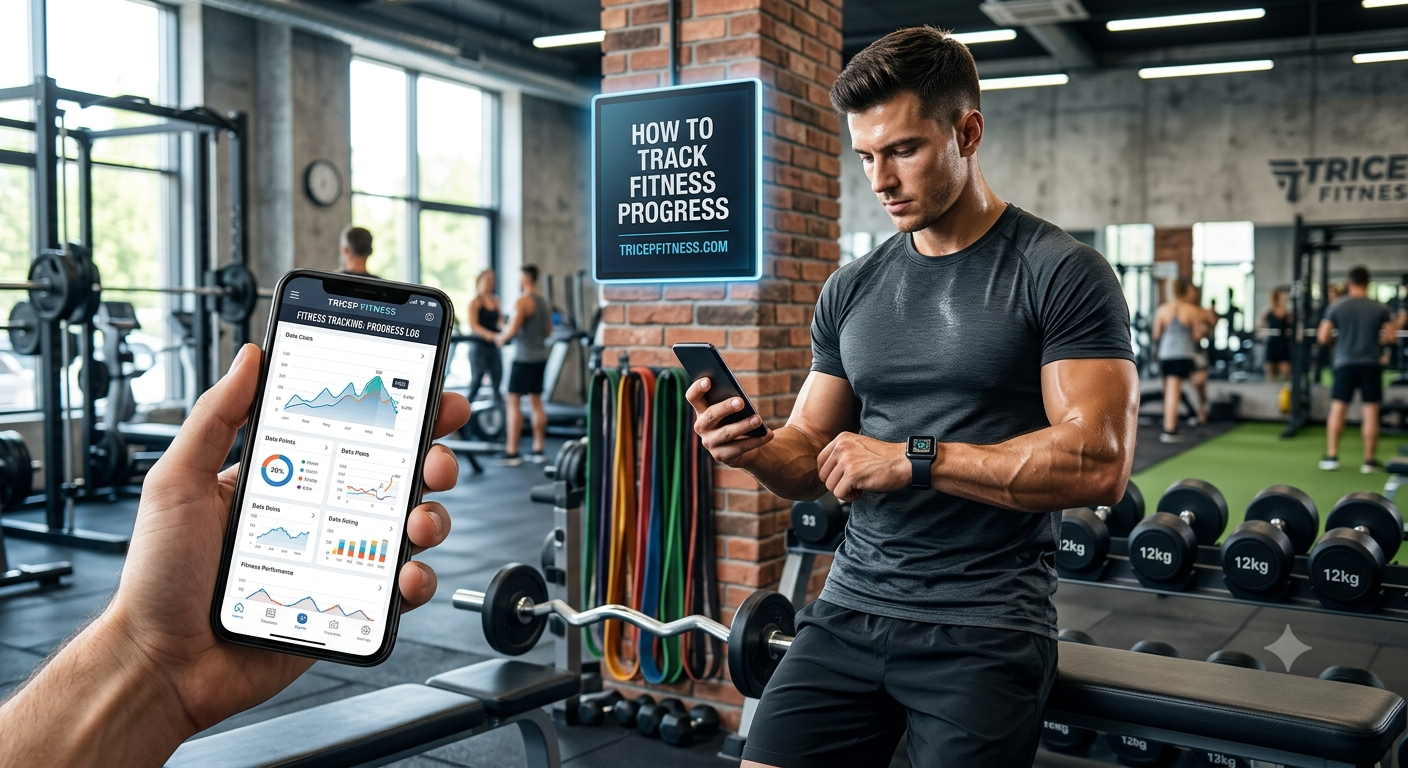
How to Track Fitness Progress: A Complete Data-Driven Guide
Relying solely on the bathroom scale is one of the most common mistakes in any health and fitness journey. Weight fluctuates daily due to water retention, glycogen storage, digestion, and hormone levels. A single morning reading can make it feel as though weeks of hard work disappeared overnight, leading to frustration, lost motivation, or unhelpful changes to a solid routine.
To get an accurate picture of your health, you need a multi-dimensional tracking strategy. Real transformation happens through a combination of shifting body composition, increasing physical strength, improving cardiovascular health, and building sustainable energy.
This guide breaks down every primary category of fitness tracking—from quantitative body measurements to performance metrics and physiological health signals—so you can measure what actually matters and stay on course.
1. Body Composition Beyond the Bathroom Scale
If your goal is fat loss or muscle gain, tracking body composition provides a far clearer picture than total body weight alone. Muscle tissue is denser than fat tissue; as you gain lean muscle and drop body fat (a process known as body recomposition), your scale weight may stay completely flat even as your waistline shrinks and your body changes shape.
A. Strategic Body Measurements
Taking circumferences at key anatomical locations with a soft flexible tape measure is one of the most reliable, low-cost ways to evaluate physical changes.
-
Waist: Measure around the narrowest point of your torso (typically just above the belly button) at the end of a normal exhale.
-
Hips: Measure around the widest point of your glutes with your feet together.
-
Chest: Wrap the tape around the fullest point of your chest across the nipple line.
-
Arms & Thighs: Measure the widest point of your upper arm (relaxed or flexed, but remain consistent) and the midpoint of your upper thigh.
Measurement Standard: Always take measurements in the morning before eating or exercising, using light pressure on the tape without pinching the skin. Repeat every 2 to 4 weeks.
B. Standardized Progress Photos
Photos capture subtle visual changes that body tape and scales miss. However, lighting and angle changes can make progress look larger—or smaller—than it actually is.
To keep your progress photos consistent and useful:
-
Lighting: Use natural, front-facing lighting (avoid harsh overhead shadows).
-
Attire: Wear form-fitting clothing or swimwear.
-
Timing: Take photos first thing in the morning on an empty stomach.
-
Angles: Capture three standard views: front, side, and back, standing in a relaxed posture.
C. Advanced Body Composition Testing
For those seeking granular data on fat mass versus lean mass, several testing modalities exist:
-
Skinfold Calipers: Measures subcutaneous fat thickness across 3 to 7 sites. High technician consistency is required for accuracy.
-
Bioelectrical Impedance Analysis (BIA): Available in smart scales and handheld devices. Quick and accessible, though highly sensitive to hydration levels.
-
DEXA (Dual-Energy X-ray Absorptiometry) Scan: The clinical gold standard for measuring body fat percentage, lean muscle distribution, and bone density.
2. Tracking Strength & Performance Metrics
Your physical performance in the gym offers immediate, objective proof of positive physiological adaptations. If you are lifting heavier weights, performing more repetitions, or recovering faster between sets, your body is adapting and growing stronger.
A. Applying Progressive Overload
Progressive overload is the foundation of strength and muscle development. It requires gradually increasing the stress placed on your musculoskeletal system over time. Tracking key workout variables ensures you continue making measurable gains:
To confirm performance progress, monitor these core indicators:
-
Load Progression: Increasing the total weight lifted for a given exercise while maintaining proper form.
-
Repetition Volume: Completing more reps with the same weight (e.g., advancing from 8 reps to 12 reps at 135 lbs).
-
Density & Efficiency: Completing the same work volume in less total time, or reducing rest intervals while keeping weight constant.
Sample Strength Progression Log (Bench Press)
--------------------------------------------------
Week 1: 135 lbs × 3 sets × 8 reps  (Volume: 3,240 lbs)
Week 2: 135 lbs × 3 sets × 10 reps (Volume: 4,050 lbs)
Week 3: 140 lbs × 3 sets × 8 reps  (Volume: 3,360 lbs)
Week 4: 140 lbs × 3 sets × 10 reps (Volume: 4,200 lbs)
B. Rating of Perceived Exertion (RPE)
Tracking weight and reps tells you what you lifted, but RPE measures how hard it felt. Based on a scale from 1 to 10, RPE helps you gauge intensity and manage fatigue:
-
RPE 7: 3 repetitions remaining in the tank (RIR 3).
-
RPE 8: 2 repetitions remaining in the tank (RIR 2).
-
RPE 9: 1 repetition remaining in the tank (RIR 1).
-
RPE 10: Maximal effort; no additional repetitions possible.
Tracking RPE alongside weight helps you spot signs of fatigue early, adjust your workouts when needed, and avoid overtraining.
3. Cardiovascular & Recovery Indicators
Fitness tracking extends beyond the weight room and mirror. Internal physiological indicators show how effectively your nervous and cardiovascular systems are recovering from physical exertion.
                          FITNESS PROGRESS METRICS
                                     │
         ┌───────────────────────────┼───────────────────────────┐
         ▼                           ▼                           ▼
  Body Composition           Performance Data            Physiological Markers
  • Tape Circumferences      • Working Sets & Reps       • Resting Heart Rate (RHR)
  • Progress Photos          • Total Lifted Volume       • Heart Rate Variability (HRV)
  • DEXA / Caliper Scans     • Reps in Reserve (RIR)     • Recovery & Sleep Efficiency
A. Resting Heart Rate (RHR)
As cardiovascular fitness improves, the heart muscle grows stronger and pumps more blood per beat (stroke volume). Consequently, your baseline Resting Heart Rate decreases.
-
Healthy Target: A typical baseline RHR ranges from 60 to 100 bpm, while endurance athletes often see baseline rates in the 40s or 50s.
-
Red Flag: A sudden 5–10 bpm spike above your normal baseline RHR can point to systemic fatigue, poor recovery, high stress, or an oncoming illness.
B. Heart Rate Variability (HRV)
Heart Rate Variability measures the variation in time between consecutive heartbeats. Higher HRV indicates dominant parasympathetic (“rest and digest”) activity and high recovery readiness. Lower HRV signals elevated sympathetic (“fight or flight”) stress, letting you know it might be time for a light active-recovery session instead of a heavy workout.
C. VO2 Max
VO2 Max represents the maximum volume of oxygen your body can use during high-intensity exercise. Many modern fitness wearables estimate VO2 Max using heart rate responses during submaximal runs or walks. Steady increases in VO2 Max reflect growing aerobic capacity and improved cardiovascular health.
4. Subjective & Qualitative Indicators
Quantitative data provides clear numbers, but subjective markers reveal how well your training routine fits into your broader lifestyle.
| Metric | How to Assess | Key Signs of Positive Progress |
| Energy Levels | Rate daily on a 1–5 scale | Consistent energy through the afternoon without relying heavily on caffeine. |
| Sleep Quality | Track time asleep and disruptions | Falling asleep within 20 minutes, fewer night awakenings, feeling refreshed. |
| Clothing Fit | How specific garments feel | Shirts fitting broader across shoulders; pants feeling looser around the waist. |
| Mood & Mindset | Daily self-reflection | Greater mental resilience, less workout anxiety, higher overall enthusiasm. |
| Joint Comfort | Post-workout soreness log | Smooth movement with manageable muscle soreness and zero joint pain. |
5. Choosing the Right Fitness Tracking System
The most effective tracking tool is the one you will actually use consistently. Here is how popular tracking methods compare:
                  ACCURACY vs. EASE OF USE

     High │                  [DEXA / Labs]
          │
  A       │      [Wearables / Smartwatches]
  C       │
  C       │      [Digital Workout Apps]
  U       │
  R       │   [Analog Journal]
  A       │
  C       │   [Scale Alone]
  Y       │
     Low  └───────────────────────────────────────────
          Low               EASE OF USE              High
Digital Apps vs. Analog Journals vs. Smart Wearables
-
Analog Notebook / Logbook:
-
Pros: Simple, reliable, zero distractions, easily customizable.
-
Cons: Requires manual analysis; no automated data visualizations or backup.
-
-
Dedicated Fitness Apps (e.g., Strong, Hevy, MyFitnessPal):
-
Pros: Calculates training volume automatically, generates progress charts, simplifies food tracking.
-
Cons: Screen time during workouts; can feel overwhelming with too many features.
-
-
Smart Wearables (e.g., Apple Watch, WHOOP, Garmin, Oura):
-
Pros: Passive data collection for HRV, continuous heart rate, sleep quality, and daily energy expenditure.
-
Cons: Higher cost; caloric burn estimates can carry a 15–30% margin of error.
-
6. How Often Should You Measure Your Progress?
Tracking metrics too often can lead to unnecessary anxiety over normal daily fluctuations. Measuring too infrequently, on the other hand, makes it harder to notice when a routine stops working.
Use this measurement frequency matrix to stay on track:
-
Daily:
-
Morning body weight (calculated as a 7-day rolling average to smooth out fluctuations)
-
Sleep score and HRV (collected passively via wearable devices)
-
-
Weekly:
-
Workout performance totals (sets, reps, and weights logged)
-
Overall adherence check (nutrition and workout consistency)
-
-
Bi-Weekly / Monthly:
-
Soft tape body measurements (waist, chest, hips, arms, thighs)
-
Standardized progress photos
-
-
Every 8 to 12 Weeks:
-
Formal body composition assessments (DEXA or caliper scans)
-
One-Rep Max (1RM) tests or peak performance checks
-
Summary Checklist for Long-Term Success
-
Stop relying solely on scale weight. Look at body measurements, strength gains, energy levels, and photos alongside scale changes.
-
Log your workouts consistently. Track weights, reps, and sets to ensure you are applying progressive overload.
-
Control your variables. Take measurements and progress photos at the same time of day under the same conditions.
-
Focus on long-term trends. Look at 4- to 8-week trendlines rather than stressing over single-day spikes or dips.
Frequently Asked Questions (FAQs)
1. What is the most accurate way to track body fat loss at home?
Combining flexible tape body measurements with standardized progress photos and 7-day average body weight offers the most reliable picture at home. While smart scales with BIA are convenient, their daily readings fluctuate easily based on hydration, salt intake, and digestion.
2. Why is my weight staying the same even though I am working out and eating right?
This usually happens during body recomposition—when you build lean muscle mass while losing body fat at the same rate. Because muscle tissue is dense, your total weight stays flat while your body grows leaner and firmer. Check your waist measurements and workout logs to confirm progress.
3. How do I know if I am building muscle if I’m not gaining weight?
Look for consistent performance gains in your workout log. If you are lifting heavier weights or doing more reps over time while your waist measurement stays the same or decreases, you are successfully adding lean muscle mass.
4. How long does it take to see noticeable fitness progress?
Initial performance gains often appear within 2 to 3 weeks as your nervous system adapts to training. Visual body changes and measurable measurement drops usually take 4 to 8 weeks of consistent exercise and structured nutrition to become clearly visible.
5. Is it better to use a paper fitness log or a mobile app?
Both work equally well—what matters most is consistency. A paper log keeps your workouts distraction-free, while dedicated apps offer convenient visual charts and automatic volume calculations. Pick whichever method feels easier to maintain over time.
6. What should I do if my fitness progress completely stalls?
First, review your data across 3 to 4 weeks to confirm a real plateau rather than a normal short-term fluctuation. If progress has stopped, adjust one training variable at a time: tweak your daily caloric intake by 100–200 calories, increase training intensity, or adjust your overall rest and sleep schedule to support better recovery.